By loading the video, you agree to YouTube's privacy policy.
Learn more
Dashboards provide a quick overview of all relevant key figures and changes. They save time, enable efficient decisions and draw attention to potential problems.

Amazon Seller Central and Vendor Central do not provide a sufficient overview that bundles and visualizes key figures from the areas of sales, performance, returns, advertising, reviews, and content quality. We are also not aware of any ERPs that can or want to cover this.
Our first dashboards for agency clients ran through Google Data Studio. The ROPT API and the connector dataddo provided GDS with data on a daily basis.
In 2020, we launched a completely independent cloud-based dashboard for Sellers and Vendors. High performance is ensured by state-of-the-art AWS cloud solutions.
The ROPT dashboard can be tested and booked independently of an agency contract. The connection is very simple and takes only a few minutes – the data is available after a few hours.
Who is the dashboard suitable for:
- Managing director / executive level
- E-commerce decision makers
- SEO Manager
- SEA Manager
- Agencies
- Freelancers
This is what characterizes our ROPT Dashboard:
1. Analyze aggregated data from all sources simultaneously
(Seller & Vendor Account, MWS API, Advertising API, product pages).
2. Automatic 30-day comparison
3. Automatic content scoring

4. Automatic sales forecast

5. Fully dynamic depending on the desired product base
Filter view by Central (Seller or Vendor), Brand (maybe you manage more than one brand), Marketplace, Product Group or ASIN
6. If needed: Deep Analysis with even more KPIs and historical data
To investigate something in more detail, just navigate to the ROPT tool “Analytics”.
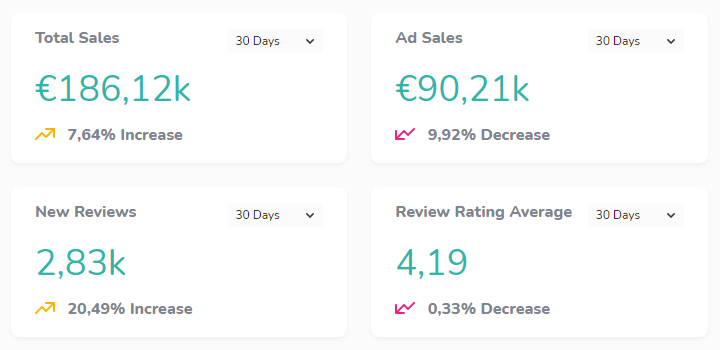
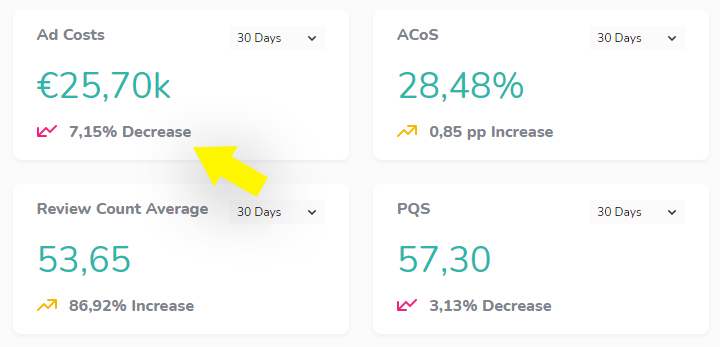
This data is presented in the ROPT dashboard:
- Sales (revenue)
- Ad Sales (campaign sales)
- Ad Costs (campaign costs)
- ACoS/ROAS/CPO (Campaign Profitability)
- New Reviews
- Review Rating Average (rating of reviews)
- Review Count Average (number of reviews)
- PQS (Product Quality Score)
- Sales & Units Trend (last 4 months)
- Sales Forecast for the current month
- Content Analysis: Optimized Content / Medium Content / Bad Content
- Sales Share (Ads vs. Organic)
- A+ Content Availability (Yes vs. No)
- Video Availability (Yes vs. No)
- Top-5 products by absolute sales
- Top-5 winners – highest growth
- Top-5 losers – lowest growth
You like our tools or analysis?
Many large and medium-sized brands rely on ROPT to manage Amazon smartly. Almost all of our tools can be tested for free.The setup is very simple and done in a few minutes. We are happy to provide personal support.
Whether one-time analysis, self-service use of the Marketing Suite or as a managed service – we have the right solution for every brand.
Let’s get to know each other!
Get in touch